本文是“JavaScript
线性代数”教程的一部分。
最近我撰写了这个线性代数系列的开篇之作。在新篇开始动笔前,我有了一个想法:使用
React
开发一个项目,来为这个系列的所有示例提供可视化功能一定很好玩!本系列的所有代码都存放于此 GitHub
仓库,本文相关代码的提交记录位于此处。
目标
在本系列刚开始写作时,只有一个章节涉及了向量的基本运算。所以,目前实现一个能渲染二维坐标网格以及能将向量可视化为箭头的组件就够用了。本文最后做出的效果如下图所示,你也可以在此处进行体验。
 二维空间中的基本向量运算
创建 React 项目
其实已经有关于创建 React
项目的最佳实践指南文章可供参考,不过在本文中,我们将尽可能减少依赖的库,并简化对项目的配置。
1
2
3
| create-react-app linear-algebra-demo
cd linear-algebra-demo
npm install --save react-sizeme styled-components
|
上面的脚本安装了两个库。第一个库 react-sizeme
可以实现当窗体大小发生变化时,重新渲染网格组件。第二个库
styled-components
则能让我们更轻松地编写组件的样式。此外,要用到我们正在开发的
linear-algebra 库,需要在 package.json
中进行如下引用:
1
2
3
4
| "dependencies": {
"linear-algebra": "file:../library",
...
}
|
项目结构
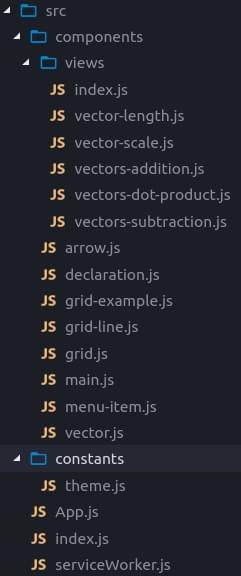 项目结构
项目结构
本系列为每个示例都在 views
目录中创建了各自的组件。我们在 index.js
中导出一个以示例名称为键、以对应组件为值的对象。
1
2
3
4
5
6
7
8
9
10
11
12
13
| import { default as VectorLength } from './vector-length'
import { default as VectorScale } from './vector-scale'
import { default as VectorsAddition } from './vectors-addition'
import { default as VectorsSubtraction } from './vectors-subtraction'
import { default as VectorsDotProduct } from './vectors-dot-product'
export default {
'vectors: addition': VectorsAddition,
'vectors: subtraction': VectorsSubtraction,
'vectors: length': VectorLength,
'vectors: scale': VectorScale,
'vectors: dot product': VectorsDotProduct
}
|
接着在 Main
组件中导入该对象,并在菜单中展示出所有的键。当用户通过菜单选择示例后,更新组件状态,并渲染新的
view。
1
2
3
4
5
6
7
8
9
10
11
12
13
14
15
16
17
18
19
20
21
22
23
24
25
26
27
28
29
30
31
32
33
34
35
36
37
38
39
40
41
42
43
44
45
46
47
| import React from 'react'
import styled from 'styled-components'
import views from './views'
import MenuItem from './menu-item'
const Container = styled.div`
...
`
const Menu = styled.div`
...
`
class Main extends React.Component {
constructor(props) {
super(props)
this.state = {
view: Object.keys(views)[0]
}
}
render() {
const { view } = this.state
const View = views[view]
const viewsNames = Object.keys(views)
const MenuItems = () =>
viewsNames.map(name => (
<MenuItem
key={name}
selected={name === view}
text={name}
onClick={() => this.setState({ view: name })}
/>
))
return (
<Container>
<View />
<Menu>
<MenuItems />
</Menu>
</Container>
)
}
}
export default Main
|
网格组件
为了在之后的示例中渲染向量和其它内容,我们设计了一个功能强大的组件,这个组件需要有这么一种投影功能:将我们熟知的直角坐标系(原点在中间,y
轴正向朝上)投影到 SVG 坐标系(原点在左上角,y
轴正向朝下)中。
1
2
3
4
5
6
7
8
9
10
| this.props.updateProject(vector => {
const scaled = vector.scaleBy(step)
const withNegatedY = new Vector(
scaled.components[0],
-scaled.components[1]
)
const middle = getSide(size) / 2
return withNegatedY.add(new Vector(middle, middle))
})
|
为了捕获到网格组件容器的大小变动,我们使用
react-size 库提供的函数将这个组件包装起来:
1
2
3
4
5
6
7
8
9
10
11
12
13
14
15
16
17
18
19
20
21
22
23
24
25
26
27
28
| ...
import { withSize } from 'react-sizeme'
...
class Grid extends React.Component {
updateProject = (size, cells) => {
const step = getStepLen(size, cells)
this.props.updateProject(() => /...)
}
componentWillReceiveProps({ size, cells }) {
if (this.props.updateProject) {
const newStepLen = getStepLen(size, cells)
const oldStepLen = getStepLen(this.props.size, cells)
if (newStepLen !== oldStepLen) {
this.updateProject(size, cells)
}
}
}
componentDidMount() {
if (this.props.updateProject) {
this.updateProject(this.props.size, this.props.cells)
}
}
}
export default withSize({ monitorHeight: true })(Grid)
|
为了便于在不同的示例中使用这个网格组件,我们编写了一个
GridExample
组件,它可以接收两个参数:一个用于渲染信息(例如向量的名称)的函数
renderInformation,以及一个用于在网格上呈现内容(如后面的箭头组件)的函数
renderGridContent。
1
2
3
4
5
6
7
8
9
10
11
12
13
14
15
16
17
18
19
20
21
22
23
24
25
26
27
28
29
30
31
32
33
34
35
36
37
38
39
| ...
import Grid from './grid'
...
class Main extends React.Component {
constructor(props) {
super(props)
this.state = {
project: undefined
}
}
render() {
const { project } = this.state
const { renderInformation, renderGridContent } = this.props
const Content = () => {
if (project && renderGridContent) {
return renderGridContent({ project })
}
return null
}
const Information = () => {
if (renderInformation) {
return renderInformation()
}
return null
}
return (
<Container>
<Grid cells={10} updateProject={project => this.setState({ project })}>
<Content />
</Grid>
<InfoContainer>
<Information />
</InfoContainer>
</Container>
)
}
}
export default Main
|
这样就能在 view 中使用这个组件了。下面以向量的加法为例测试一下:
1
2
3
4
5
6
7
8
9
10
11
12
13
14
15
16
17
18
19
20
21
22
23
24
25
26
27
28
29
30
31
32
33
34
35
36
37
38
39
40
41
42
43
44
45
46
47
48
49
| import React from 'react'
import { withTheme } from 'styled-components'
import { Vector } from 'linear-algebra/vector'
import GridExample from '../grid-example'
import Arrow from '../arrow'
import VectorView from '../vector'
const VectorsAddition = ({ theme }) => {
const one = new Vector(0, 5)
const other = new Vector(6, 2)
const oneName = 'v⃗'
const otherName = 'w⃗'
const oneColor = theme.color.green
const otherColor = theme.color.red
const sum = one.add(other)
const sumColor = theme.color.blue
const sumText = `${oneName} + ${otherName}`
const renderInformation = () => (
<>
<VectorView components={one.components} name={oneName} color={oneColor} />
<VectorView
components={other.components}
name={otherName}
color={otherColor}
/>
<VectorView components={sum.components} name={sumText} color={sumColor} />
</>
)
const renderGridContent = ({ project }) => (
<>
<Arrow project={project} vector={one} text={oneName} color={oneColor} />
<Arrow
project={project}
vector={other}
text={otherName}
color={otherColor}
/>
<Arrow project={project} vector={sum} text={sumText} color={sumColor} />
</>
)
const props = { renderInformation, renderGridContent }
return <GridExample {...props} />
}
export default withTheme(VectorsAddition)
|
箭头组件
箭头组件由 3 个 SVG 元素组成:line
用于显示箭头的线、polygon
用于显示箭头的头、text
用于显示向量名称。此外,我们需要接收 project
函数,用于将箭头放在网格中正确的位置上。
1
2
3
4
5
6
7
8
9
10
11
12
13
14
15
16
17
18
19
20
21
22
23
24
25
26
27
28
29
30
31
32
33
34
35
36
37
38
39
40
41
42
43
44
45
46
47
48
49
50
51
52
53
54
55
56
57
58
59
60
| import React from 'react'
import styled from 'styled-components'
import { Vector } from 'linear-algebra/vector'
const Arrow = styled.line`
stroke-width: 2px;
stroke: ${p => p.color};
`
const Head = styled.polygon`
fill: ${p => p.color};
`
const Text = styled.text`
font-size: 24px;
fill: ${p => p.color};
`
export default ({ vector, text, color, project }) => {
const direction = vector.normalize()
const headStart = direction.scaleBy(vector.length() - 0.6)
const headSide = new Vector(
direction.components[1],
-direction.components[0]
).scaleBy(0.2)
const headPoints = [
headStart.add(headSide),
headStart.subtract(headSide),
vector
]
.map(project)
.map(v => v.components)
const projectedStart = project(new Vector(0, 0))
const projectedEnd = project(vector)
const PositionedText = () => {
if (!text) return null
const { components } = project(vector.withLength(vector.length() + 0.2))
return (
<Text color={color} x={components[0]} y={components[1]}>
{text}
</Text>
)
}
return (
<g>
<Arrow
color={color}
x1={projectedStart.components[0]}
y1={projectedStart.components[1]}
x2={projectedEnd.components[0]}
y2={projectedEnd.components[1]}
/>
<Head color={color} points={headPoints} />
<PositionedText />
</g>
)
}
|
通过结合 React 与 SVG
可以做更多有意思的事。在本系列的后面章节中,我们会给这个可视化示例添加更多的功能。最后推荐另一篇类似的文章:使用
React 与 SVG
制作复杂的条形图。