Numpy与Pandas学习记录
Numpy为Python下的科学计算库,用于快速处理数据、科学计算等。
pandas 是基于 Numpy 构建的含有更高级数据结构和工具的数据分析包
Numpy 库文档:https://docs.scipy.org/doc/numpy-dev/user/quickstart.html
Pandas 库文档:http://pandas.pydata.org/pandas-docs/version/0.17.0/
1 | import numpy as np |
Numpy的基本使用
创建数组
1 | array = np.array([1, 4, 5, 8], float) |
output>>[ 1. 4. 5. 8.]
np.array最后的参数表示数据类型为浮点。因此显示数组时整数后会有一个小数点。
重建的数组中所有数据必须为相同的数据类型
The array object class is the foundation of Numpy, and Numpy arrays are like lists in Python, except that every thing inside an array must be of the same type, like int or float.
创建二维数组
同理:
1 | array = np.array([[1, 2, 3], [4, 5, 6]], float) # a 2D array/Matrix |
output>>[[ 1. 2. 3.][ 4. 5. 6.]]
存取元素
与Python基本用法一致
1 | array = np.array([1, 4, 5, 8], float) |
output>>[ 1. 4. 5. 8.] 1
print array[1]##显示数组中下标为1的数据
output>>4.0 1
print array[:2]##显示数组从下标0开始向后的2个数据
output>>[ 1. 4.] 1
2array[1]=5.0##通过下标修改对应数据
print array[1]
output>>5.0
1 | two_D_array=np.array([[1, 2, 3], [4, 5, 6]], float)##创建2d数组 |
output>>[[ 1. 2. 3.][ 4. 5. 6.]] 1
print two_D_array[1][1]##显示下标为1的数据组中的下标为1的数据
output>>5.0 1
print two_D_array[1, :]##显示下标为1的数据组中所有数据
output>>[ 4. 5. 6.] 1
print two_D_array[:, 2]##显示所有数据组中的下标为2的数据
output>>[ 3. 6.]
数组运算
数组间的四则运算 1
2array_1 = np.array([1, 2, 3], float)
array_2 = np.array([5, 2, 6], float)1
2
3
4print array_1 + array_2
print array_1 - array_2
print array_1 * array_2
print array_1 / array_2
output>>[ 6. 4. 9.]
output>>[-4. 0. -3.]
output>>[ 5. 4. 18.]
output>>[ 0.2 1. 0.5]
二维数组间的四则运算 1
2array_1 = np.array([[1, 2], [3, 4]], float)
array_2 = np.array([[5, 6], [7, 8]], float)1
2
3
4print array_1 + array_2
print array_1 - array_2
print array_1 * array_2
print array_1 / array_2
output>>[[ 6. 8.][ 10. 12.]]
output>>[[-4. -4.][-4. -4.]]
output>>[[ 5. 12.][ 21. 32.]]
output>>[[ 0.2 0.33333333][ 0.42857143 0.5]]
数据快速处理
1 | array_1 = np.array([1, 2, 3], float) |
求和:
1 | print np.sum(array_1) |
output>>6.0
output>>21.0
求均值:
1 | print np.mean(array_1) |
output>>2.0
output>>7.0
求方差:
1 | print np.var(array_1) |
output>>0.666666666667
output>>0.666666666667
求标准差:
1 | print np.std(array_1) |
output>>0.816496580928
output>>0.816496580928
求内积: 1
print np.dot(array_1, array_2)
output>>[ 44.]
1 | import pandas as pd |
Pandas的基本使用
1 | series = pd.Series(['Dave', 'Cheng-Han', 'Udacity', 42, -1789710578]) |
| index | column |
|---|---|
| 0 | Dave |
| 1 | Cheng-Han |
| 2 | Udacity |
| 3 | 42 |
| 4 | -1789710578 |
dtype: object
1 | ##通过Python字典对象创建一个数据系列,自动使用递增整型作为索引。 |
| column0 | column1 |
|---|---|
| Instructor | Dave |
| Curriculum Manager | Cheng-Han |
| Course Number | 359 |
| Power Level | 9001 |
dtype: object
1 | ##为数据添加了索引,此时可以通过索引来选择数据: |
output>>Dave 1
print series[['Instructor', 'Curriculum Manager', 'Course Number']]
| column0 | column1 |
|---|---|
| Instructor | Dave |
| Curriculum Manager | Cheng-Han |
| Course Number | 359 |
dtype: object
通过bool来显示数据是否满足筛选条件: 1
2cuteness = pd.Series([1, 2, 3, 4, 5], index=['Cockroach', 'Fish', 'Mini Pig',
'Puppy', 'Kitten'])1
print cuteness > 3
| column0 | column1 |
|---|---|
| Cockroach | False |
| Fish | False |
| Mini Pig | False |
| Puppy | True |
| Kitten | True |
dtype: bool
只显示满足条件的数据: 1
print cuteness[cuteness > 3]
| column0 | column1 |
|---|---|
| Puppy | True |
| Kitten | True |
dtype: int64
使用数据框架: 1
2
3
4
5
6
7data = {'year': [2010, 2011, 2012, 2011, 2012, 2010, 2011, 2012],
'team': ['Bears', 'Bears', 'Bears', 'Packers', 'Packers', 'Lions',
'Lions', 'Lions'],
'wins': [11, 8, 10, 15, 11, 6, 10, 4],
'losses': [5, 8, 6, 1, 5, 10, 6, 12]}
football = pd.DataFrame(data)
print football
显示数据框架各列数据格式:
##to get the datatype for each column 1
print football.dtypes
losses int64
team object
wins int64
year int64
dtype: object
对数据列进行快速统计与汇总:
1 | ## useful for seeing basic statistics of the dataframe's numerical columns |
output>>
losses wins year count 8.000000 8.000000 8.000000##总数
mean 6.625000 9.375000 2011.125000##均值
std 3.377975 3.377975 0.834523##标准差
min 1.000000 4.000000 2010.000000##最小值
25% 5.000000 7.500000 2010.750000
50% 6.000000 10.000000 2011.000000
75% 8.500000 11.000000 2012.000000
max 12.000000 15.000000 2012.000000##最大值
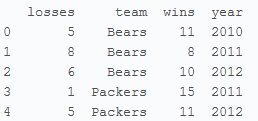
显示前5行 1
print football.head()
output>>
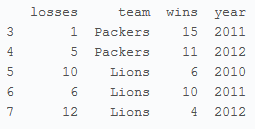
显示后5行 1
print football.tail()
output>>
通过索引来访问对应列 1
2print football['year']##显示year这一列
##也可用print football.year
output>>
0 2010 1 2011 2 2012 3 2011 4 2012 5 2010 6 2011 7 2012 Name: year, dtype: int64
显示year wins losses三列 1
print football[['year', 'wins', 'losses']]
output>>
year wins losses 0 2010 11 5 1 2011 8 8 2 2012 10 6 3 2011 15 1 4 2012 11 5 5 2010 6 10 6 2011 10 6 7 2012 4 12
显示第[0]行数据 1
print football.loc[[0]]
output>> losses team wins year 0 5 Bears 11 2010
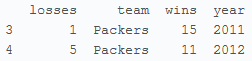
显示从第[3]行到第[5]行 1
print football[3:5]
output>>
losses team wins year 3 1 Packers 15 2011 4 5 Packers 11 2012
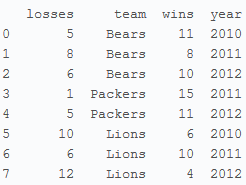
显示wins中大于10的行 1
print football[football.wins > 10]
output>>
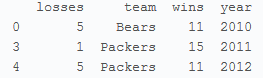
显示wins大于10且team为Packers的行 1
print football[(football.wins > 10) & (football.team == "Packers")]
output>>